About the Dashboard
The Okanagan Indicators Dashboard allows users to explore how weather patterns and water quality in the valley have shifted over time, based on historical records. All the indicators are based on direct, physically measured observations. The information is presented as clearly as possible, without intensive statistical analysis.
Many indicators show clear long-term changes, and some indicators do not. Both are valuable, since it is important to know what has changed, and what has not. Indicators that do not show clear trends may change in the future. We will update this page as new information comes available.

What is an Indicator?
According to the U.S. Environmental Protection Agency definition, indicators are observations or calculations used to track conditions and trends. They are tools to answer the question: has something changed? Indicators are not static and should be updated regularly to see if the answer to that question has changed.
Each indicator looks at a specific component of the natural world. Therefore, conclusions about how the Okanagan has changed should be drawn by looking at multiple indicators and understanding the story they tell together. No one indicator tells the whole story.
An Effective Indicator is:
Relevant – it is clear and can be understood by a broad audience, avoiding a need for technical knowledge.
Representative – as a package, the indicators provide a representative picture of a broad range of characteristics about climate change.
Traceable – the indicator is calculated using known methods, and the data is accessible and can be verified.
Timely – the indicator is updated at least annually so it can be used to detect changes.
Based on good data – the data used is of good quality and relevant to the parameter of interest.
– World Meteorological Organization
Climate Change Indicators

The Climate Change Indicators were inspired by the 2020 Climate Projections for the Okanagan report, which provides a projection of what the Okanagan’s climate will be in 2050. That projection raises the following questions: What is the current trend for the climate? Has it changed from the baseline used in the past? Are we on track for the changes outlined in the projections report?
To answer these questions, the Okanagan Basin Water Board has developed over 30 climate change indicators that can be viewed for annual or seasonal trends. These include temperature, precipitation, lake inflows, and streamflow categories. Indicators compare annual values to a reference point to determine whether a year is above or below normal. By using historical data from weather and streamflow stations, these indicators provide insight into long-term historical trends.
Each Indicator Includes:
- About Section – with a description of the indicator.
- Change Statement – which summarizes what the indicator shows across the valley.
- Description – of what the indicator shows across all locations and seasons.
- Indicator Graph – a graph of the indicator over time.
- Save Button – to allow the user to save plots.
- Summary Table – which provides some summary statistics.

The indicator data was acquired from Environment and Climate Change Canada, Water Survey of Canada, and the Province of B.C. The length of the record depends on data availability and quality. For some data sets, data from the previous year is taken from real-time data and is still subject to review by the parent agency (i.e., it is ‘unofficial’ until it has a final review). The methods used for calculating the indicators can be found here.
What is a Baseline?
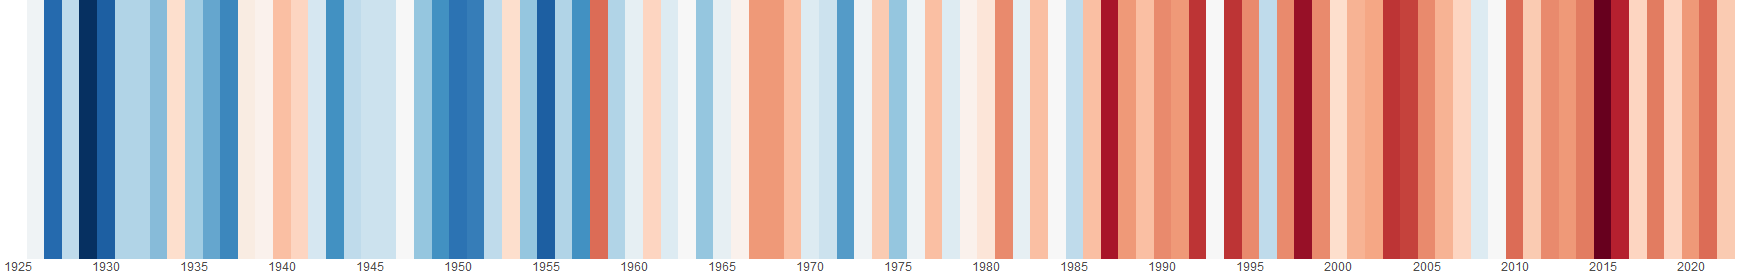
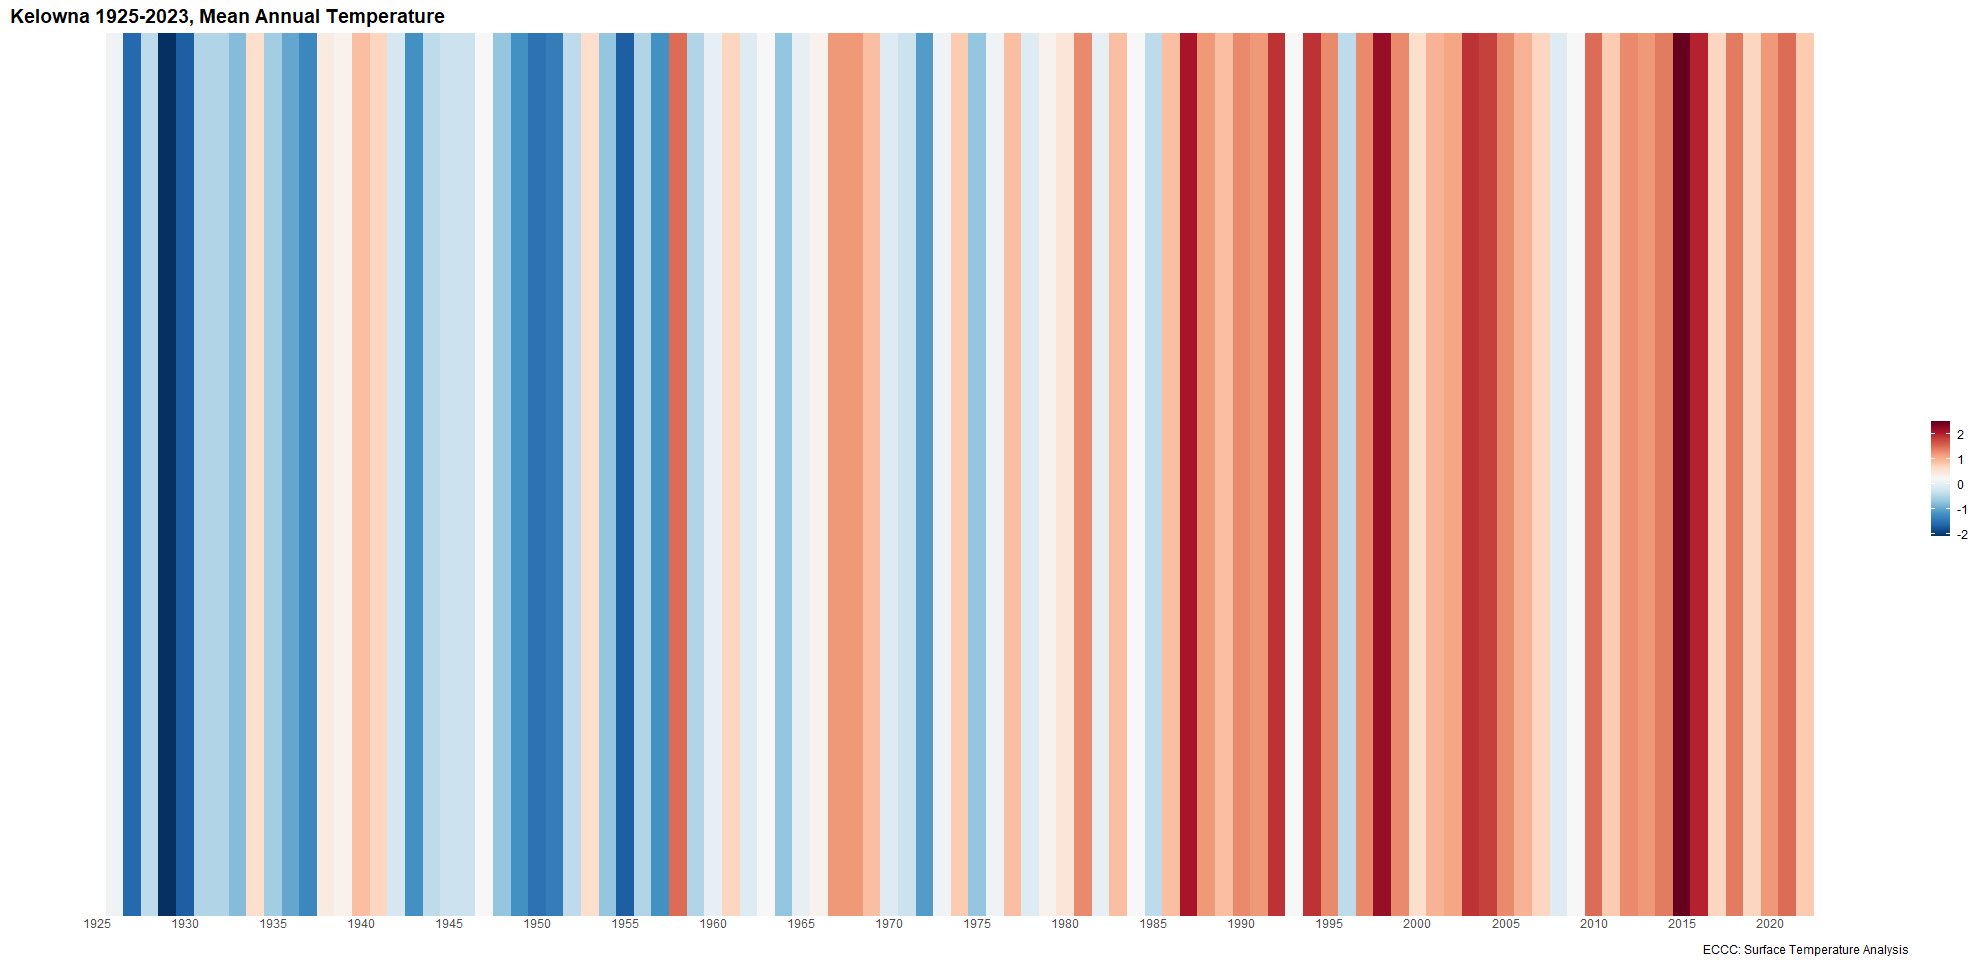
To answer the question, “Has something changed?” we need a baseline to compare to. The baseline defines “normal” conditions, such as the average mean temperature in Kelowna. We can use that baseline as a reference point to, for example, see if a year is warmer or colder than normal (See Figure 4).
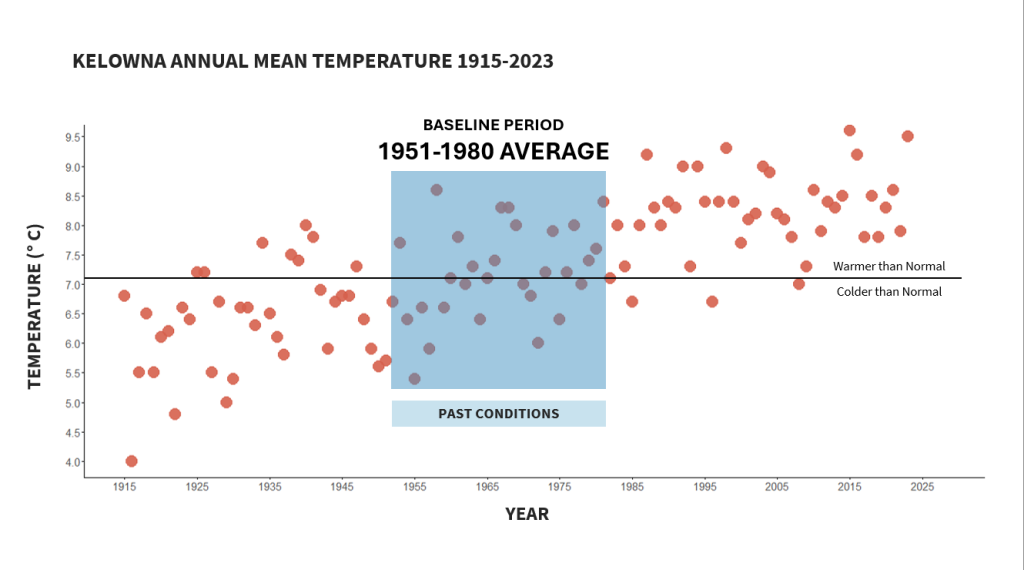
The baseline needs to be at least 30 years to account for natural variability in the climate. For most indicators in this project, the baseline we use is the average from 1951 to 1980.
There is no one universal baseline period across climate scenes, and each one is a compromise between data quality and which years you include. In Okanagan, weather observations taken earlier in the 20th Century were measured with instruments and methods different from those used today. So, although the climate began changing measurably in the 1970s, we used the 1951-1980 baseline as a conservative compromise, using the highest-quality data available before the climate changed too drastically. For stream flow indicators, we used the baseline from 1971 to 2000 because most data was only available in the 1970s.
What You Can Do
We can all do something to help combat climate change. Here are a few resources to get started.
Resources for Residents:
- Building Climate Resilience in the Okanagan – A Homeowner’s Resource Guide
- Slow it. Spread it. Sink it! An Okanagan Homeowner’s Guide to Using Rain as a Resource
- Make Water Work – Help for Okanagan residents to conserve water outdoors in summer
- Vernon’s Climate Action Plan
- Kelowna’s Climate Action Plan
- Penticton’s Climate Action Plan
- Canada Climate Action Plan
- British Columbia Climate Action
- Clean BC

Resources for Educators:
- Okanagan Climate Infographic
- Our Relationship with Water in the Okanagan Education Guide
- Be an Okanagan WaterWise Climate Hero Booklet
- Okanagan Basin Waterscape Poster
- Climate Ready BC: Preparing Together
Resources for Local Governments:
- CivicInfo BC – Okanagan Basin Water Board Planning Guides Database – Policies and best practices for communities to address climate change challenges
More about the Dashboard:
Water Quality Indicators
The indicators dashboard also shows a water quality index for several lakes in the Okanagan, prepared by Larratt Aquatics Consulting, LTD. This index, based on nationally standard methods, assesses changes in water quality over time using 15 different variables. Study sites, shown on a map of the Okanagan, are colour-coded from poor to excellent, depending on the results. The water quality ratings can be compared over time to understand how water quality has changed in the valley. The methods used to create the index are available in the information tab under the water quality index.
Navigating the Dashboard

The dashboard is broken into four major sections, accessible on the left panel. Each section has a dropdown menu that can be used to navigate that section. The sections are 1) about the climate indicators, 2) key climate indicators, 3) all climate indicators, and 4) the water quality indicators.
Key Climate Indicators – provides a short list of indicators across temperature, precipitation, and hydrology, which together give a sense of the effects of climate change across the valley. Navigate this section by selecting the indicator on the left-hand panel and then selecting the location.

All Climate Indicators – shows the full list of indicators and provides seasonal as well as annual data. To navigate this section, select the parameter of interest, such as precipitation and on the page select the location, indicator, and season from the dropdown menus.

Water Quality Index – provides a general score for water quality at multiple locations in the Okanagan, for both surface and deep waters. Navigate this section by clicking on points on the map to view their results. The control panel on the right allows you to select the depth, year, and chart type of interest. Please see the information section for a detailed description of the index and how to navigate and interpret the results.

Methodologies
The methods used to calculate the indicators can be found here:
Other Resources
Climate Change
- Global Climate Change Indicators from the World Meteorological Centre
- Canada-Wide Climate Change Indicators
- Canada Wide Climate Change Data from Environmental and Climate Change Canada
- Information on Climate Change from the Intergovernmental Panel on Climate Change
- Climate change Indicators for the United States from the Environmental Protection Agency
Water Quality
Land Acknowledgment
We acknowledge this work was done on the traditional, ancestral, and unceded tm̓xʷúlaʔxʷ (land) of the syilx (Okanagan) people who have resided here since time immemorial. We honour and respect this land and the siwlɬk (water) which flows through the valley and connects us all.
References
Albers S (2017). “tidyhydat: Extract and Tidy Canadian Hydrometric Data.” The Journal of Open Source Software, 2(20). doi:10.21105/joss.00511, http://dx.doi.org/10.21105/joss.00511.
Associated Environmental (2020). Okanagan Environmental Flow Needs Project – Phase 1 and 2 Summary Report 1.118
B.C. Ministry of Environment (2016). Indicators of Climate Change for British Columbia: 2016 Update.
Climate Atlas of Canada (2023). Map. https://climateatlas.ca/ (Accessed: 30.06.2023).
Climate Data (2023a). Download AHCCD. https://climatedata.ca/variable/ (Accessed: 14.05.2023).
Climate Data (2023b). Download AHCCD. https://climatedata.ca/download/#ahccd-download (Accessed: 22.05.2023).
Climate Projections for the Okanagan Region. (2020). Accessed (08.05.2023). https://www.rdos.bc.ca/assets/PLANNING/AreaX/2020/ClimateProjections/FinalReport.pdf
Environment and Climate Change Canada (2023). Daily Climate Data. https://climate-change.canada.ca/climate-data/#/daily-climate-data (Accessed: 22.05.2023).
Environmental Protection Agency. (2023, August 31). Climate Change Indicators. https://www.epa.gov/climate-indicators/about-indicators
Gulev, S.K., P.W. Thorne, J. Ahn, F.J. Dentener, C.M. Domingues, S. Gerland, D. Gong, D.S. Kaufman, H.C. Nnamchi, J. Quaas, J.A. Rivera, S. Sathyendranath, S.L. Smith, B. Trewin, K. von Schuckmann, and R.S. Vose, 2021: Changing State of the Climate System. In Climate Change 2021: The Physical Science Basis. Contribution of Working Group I to the Sixth Assessment Report of the Intergovernmental Panel on Climate Change [Masson-Delmotte, V., P. Zhai, A. Pirani, S.L. Connors, C. Péan, S. Berger, N. Caud, Y. Chen, L. Goldfarb, M.I. Gomis, M. Huang, K. Leitzell, E. Lonnoy, J.B.R. Matthews, T.K. Maycock, T. Waterfield, O. Yelekçi, R. Yu, and B. Zhou (eds.)]. Cambridge University Press, Cambridge, United Kingdom and New York, NY, USA, pp. 287–422, doi: 10.1017/9781009157896.004.
Ishaq, S., Nahiduzzaman, K. M., Sultana, S. R., Rana, A., Mohammadiun, S., Yousefi, P., … & Sadiq, R. (2022). Flood-resilient governance in Okanagan valley of British Columbia: current practices and future directives. Environmental Reviews, 31(2), 327-347.
LaZerte, S. E and Albers S. (2018). weathercan: Download and format weather data from Environment and Climate Change Canada. The Journal of Open Source Software 3(22):571. doi:10.21105/joss.00571.
López-Moreno, J. I., Pomeroy, J. W., Alonso-González, E., Morán-Tejeda, E., & Revuelto, J. (2020). Decoupling of warming mountain snowpacks from hydrological regimes. Environmental Research Letters, 15(11), 114006. https://doi.org/10.1088/1748-9326/abb55f
Okanagan Nation Alliance (2020). Environmental Flow Needs Assessment in the Okanagan Basin: Appendix-B5 Mission Creek. https://obwb.ca/efndocs/Appendix-B5.pdf
Ombadi, M., Risser, M. D., Rhoades, A. M., & Varadharajan, C. (2023). A warming-induced reduction in snow fraction amplifies rainfall extremes. Nature, 619(7969), 305–310. https://doi.org/10.1038/s41586-023-06092-7
Parisien, M.-A., Barber, Q. E., Bourbonnais, M. L., Daniels, L. D., Flannigan, M. D., Gray, R. W., Hoffman, K. M., Jain, P., Stephens, S. L., Taylor, S. W., & Whitman, E. (2023). Abrupt, climate-induced increase in wildfires in British Columbia since the mid-2000s. Communications Earth & Environment, 4(1), Article 1. https://doi.org/10.1038/s43247-023-00977-1
Peters-Lidard, C. D., Rose, K. C., Kiang, J. E., Strobel, M. L., Anderson, M. L., Byrd, A. R., Kolian, M. J., Brekke, L. D., & Arndt, D. S. (2021). Indicators of climate change impacts on the water cycle and water management. Climatic Change, 165(1), 36. https://doi.org/10.1007/s10584-021-03057-5.
Pinna (2020). Climate Projections for the Okanagan Region. https://www.rdos.bc.ca/assets/PLANNING/AreaX/2020/ClimateProjections/FinalReport.pdf
United States Environmental Protection Agency (2023a). Climate Change Indicators in the United States. https://www.epa.gov/climate-indicators (Accessed: 15.05.2023).
United States Environmental Protection Agency (2023b). Climate Change Indicators: Streamflow. https://www.epa.gov/climate-indicators/climate-change-indicators-streamflow (Accessed: 15.05.2023).
United States Geological Survey (2015). Hydrological Climate Change Indicators https://www.usgs.gov/centers/new-york-water-science-center/science/hydrologic-climate-change-indicators (Accessed: 11.12.2023).
Water Survey of Canada (2018). National Water Data Archive: HYDAT. https://www.canada.ca/en/environment-climate-change/services/water-overview/quantity/monitoring/survey/data-products-services/national-archive-hydat.html
Water Survey of Canada (2023). Historical Hydrometric Data Search. https://wateroffice.ec.gc.ca/search/historical_e.html (Accessed: 11.12.2023).
Water Sustainability Act (2016). British Columbia.
White, R. H., Anderson, S., Booth, J. F., Braich, G., Draeger, C., Fei, C., … & West, G. (2023). The unprecedented Pacific Northwest heatwave of June 2021. Nature Communications, 14(1), 727.
Williams, M., & Eggleston, S., (2022). Using Indicators To Explain Our Changing Climate To Policymakers And The Public. World Meteorological Organization. https://public-old.wmo.int/en/resources/bulletin/using-indicators-explain-our-changing-climate-policymakers-and-public (Assessed: 10.05. 2023).
World Meteorological Organization. (2023 edition). Step-by-step Guidelines for the Elaboration of Regional State of the Climate Report. WMO-No. 1298. https://library.wmo.int/viewer/66285/download?file=1298_en.pdf&type=pdf&navigator=1
Special Thanks
Thank you to the experts who provided advice and guidance on the project:
- Dr. Brian Guy
- Bob Hrasko
- Dr. Denise Neilsen
- Drew Lejbak
- Dr. Elinor McGrath
- Jamie Self
- Dr. Jeremy Fyke
- Dr. Mel Reasoner
- Dr. Paul Whitfield
- Robert Sandford