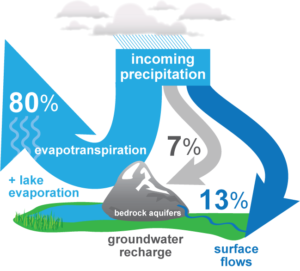
80% of incoming precipitation is lost to evapotranspiration from plants and evaporation from lake surfaces.
Another 13% goes to surface flows, and groundwater recharge is 7%.
Reservoir capacity
There are 36 large storage reservoirs in the basin on the plateaus east and west of the main Okanagan valley.
Together, these reservoirs can store 133,000 ML of water, about 20% of the annual total volume of water that flows into the main valley lakes.
Creeks
Mission Creek is the largest creek in the Okanagan, producing 28% of the total flow in the basin. Trout and Vernon Creeks are the second and third largest contributors, each producing about 7% of the total.
Imported Water
An average of 17,000 million litres is imported each year from adjacent watersheds, the largest volume from the Duteau Plateau in the North Okanagan that otherwise drains to the Shuswap Basin.
Stream-flow
Stream-flow during the seven months of August to February accounts for only 14% of total basin recharge, while the 5-month period March to July accounts for 86%. The August to February total stream-flow averages about 18,200 ML per month, which is primarily contributed by groundwater.
Stream-flow Monitoring
Within the last decade, the network of stations that measure stream-flow and lake levels has been reduced to about half of historical levels, presenting a challenge for hydrologic modeling and water management activities.
Evaporation
Evaporation from Okanagan Lake and other main valley lakes is significant and has important consequences for dam operations and for improved modeling and forecasting of water supply in the basin, but cannot be precisely estimated without proper measurements of lake evaporation.
Read More:
More Key Findings: